
Filmgoing and Film Popularity in Antwerp and Ghent, 1952
International statistics show that Belgians went more to the cinema than cinemagoers in neighbouring countries. The Cinema Belgica database offers researchers plenty of data for calculating and analysing cinema's popularity in the country. In this story, film historian and economist John Sedgwick outlines his robust POPSTAT methodology for investigating cinema's popularity in the cities of Ghent and Antwerp in 1952.
By John Sedgwick
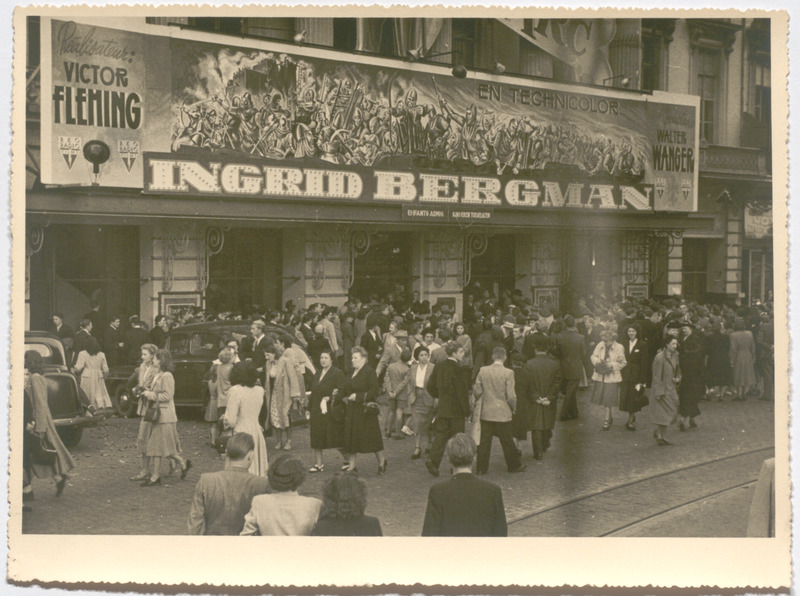
Cinemagoers queuing in front of the Capitole cinema in Ghent in October 1948. The cinema is screening Victor Fleming's Joan of Arc (1948), starring Ingrid Bergman. The film ran for three weeks. (source: Rijksarchief Gent)

Advertisement for Joan of Arc (1948) in the local newspaper De Gentenaar (October 28th 1948)
7th in international rankings of cinema attendances
A UNESCO publication of 1952 ranks Belgium 7th in international rankings of cinema attendances per head of population with 14 visits per annum, just behind Italy and ahead of the German Federal Republic, France, and the Netherlands. Headed by Great Britain with 28 visits per head, Italy and Belgium lead the list of non-English speaking countries. This story focuses on cinema's popularity in two Belgian-Flemish cities in 1952, Ghent and Antwerp. This story is based on a methodology aiming at understanding cinema's popularity by using statistical data.
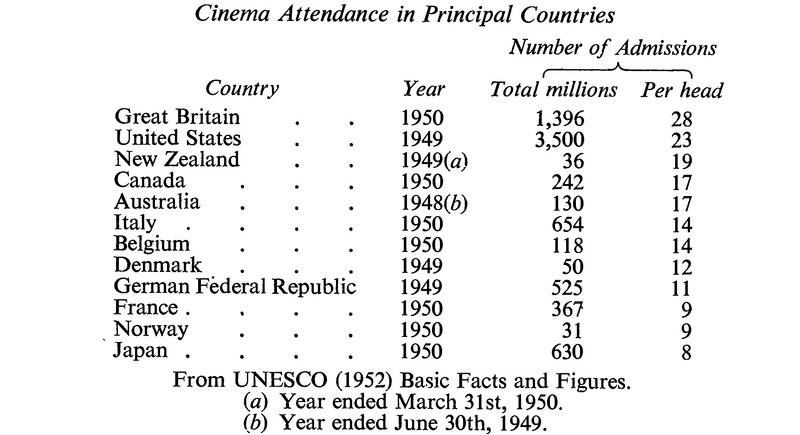
International cinema attendance data show the medium's popularity in Belgium in terms of the number of admissions per head. (source: UNESCO data, reproduced in Browning and Sorrell, 1954: 136)
Box-office revenues not made public
The study of cinema's popularity rests on empirical foundations. Without pre-judgement, the essential question is: what films did people go to watch? And what does this tell us about their preferences? These questions are problematic because industry statistics concerning the box-office revenues generated by films on release were not made public, or they are no longer available. The best systematic evidence about cinema's performance in the post-World War 2 era was published annually in industry yearbooks associated with the trade journals like Variety in the form of a list of the rental incomes of 'Top Grossing' films. Of course, Variety's list was specific to the North American market.
POPSTAT methodology
For this reason, any attempt on the part of researchers to maintain that Film X was more popular than Film Y in a particular locality at a moment in time requires a proxy method of measurement. In the absence of box-office data, POPSTAT was designed to fill this gap. However, the technique yields other benefits. Not only does it allow researchers to rank order films in terms of audience preferences, but in doing so lays open how films circulated within localities and the hierarchy of cinemas through which they moved.
The POPSTAT Index of Film Popularity is calculated for a population of films screened in a population of cinemas, particular to a locality. It is computed for each ith film in period t based on:
- the box-office potential of each jth cinema at which the ith film plays at time t, relative to other cinemas. This known as the cinema weight a;
- the billing status b of the ith film at the jth cinema at time t;
- the length of run l of the ith film at the jth cinema at time t.
The symbol sigma Σ is a summation instruction.
Price information is essential in estimating film popularity. Essentially, the argument is that cinemas differ in revenue potential—the product of the average price paid by customers and the number of tickets sold. Ranking them in terms of this potential allows the distinction to be made between the box-office potential of cinemas along a continuum from box-office rich to box-office poor. Accordingly, analysis that treats all cinemas and, or screenings, as equivalents will not capture this aspect of the film distribution process.
Consumers paying higher prices
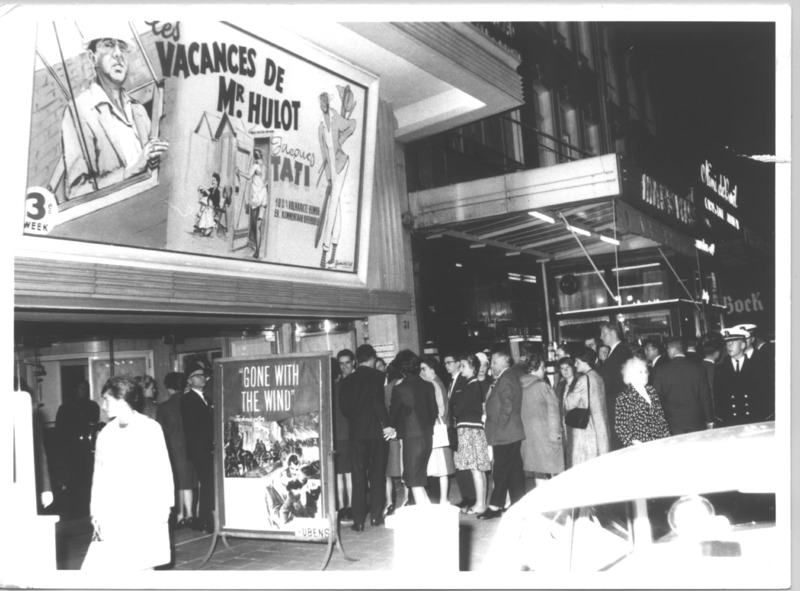
The Antwerp cinema Vendôme shows Jacques Tati’s Les Vacances de Monsieur Hulot (1953), as well as the evergreen Gone with the Wind (1939). (source: Paul Corluy)
Does a question arise from this empirical observation concerning why film consumers were prepared to pay higher prices to watch films than they needed to? The answer is to be found in the desire on the part of audiences to (a) watch films earlier, rather than later, in their distribution cycle – what economists' term 'time preference'; and (b) watch films in better-accoutred environments. When both conditions are met, audiences will watch films in box-office rich cinemas.
Comparable intensity of cinemagoing with British cities
Evidence presented in Table 1 below represents information about the plentiful supply of cinemas and seating in Ghent and Antwerp. Indeed, the statistics presented in this table show a comparable intensity of cinema and seating concentration with that recorded for British cities by Browning and Sorrell (1954) in their monumental statistical survey of cinemagoing in Great Britain at the time.
| Antwerp | Ghent | |
|---|---|---|
| City Population | 308.079 | 218.232 |
| Total Cinemas | 52 | 38 |
| Population per cinema | 5.925 | 5.743 |
| Total Seats | 42.787 | 23.310 |
| Population per seat | 7,2 | 9,4 |
| Sample Cinemas | 30 | 33 |
| Seats in sample cinemas | 28.281 | 20.566 |
| Seats in sample cinemas as a proportion of Total | 0,66 | 0,88 |
| Mean seats of sample cinemas | 943 | 623 |
| Median seats of sample cinemas | 810 | 560 |
| Sample cinemas max. seats | 2.000 | 1.663 |
| Sample cinemas min. seats | 300 | 186 |
| Sample cinemas with 1,000 or more seats | 11 | 2 |
| Sample cinemas with 500 or fewer seats | 4 | 10 |
| Not included in the sample | ||
| Non-sample cinemas (excluded) | 22 | 5 |
| Non-sample cinema seats (excluded) | 14.506 | 2.744 |
| Non-sample mean cinema seats (excluded) | 659 | 549 |
Source: Cinema Belgica dataset
Notes: Population data are taken from census returns of 1947. Antwerp population and cinema totals include the suburb of Borgerhout. Ghent population and cinema totals include the suburbs of Gentbrugge, Ledeberg, and Sint-Amandsberg.
The Cinema Belgica dataset is drawn from daily newspaper listings in newspapers (De Gentenaar and Vooruit), from which we track the circulation of films. Unfortunately, this source does not include admission prices, without which it is not possible to calculate cinema weights. Another problem is that not all cinemas advertise their programmes in these papers.
Programming data from these newspapers is supplemented with information published by two national organizations engaged in cinema publicity and advertising—respectively, the Chambre Syndicale Belge de la Publicité Cinématographique and the Union Belge des Annonceurs. Their third annual report published in 1954 contains the national listing of cinemas broken into regional urban locations. Against each cinema entry, data about their seating capacity, number of weekly screenings, and quarterly attendance figures, expressed as weekly averages, is listed. Further, and most importantly for the purpose at hand, each cinema was attributed a classification code, which determined the price per meter that advertisers were required to pay for screened promotions.
Admission prices
This pricing information can be used to get around the absence of admission prices. Based upon the assumption that advertisers were prepared to pay more to have greater access to larger, high ticket price paying audiences, cinema advertising prices can be thought of as a proxy for the revenue potential of cinemas. Multivariate regression analysis is conducted to test the validity of this approach, in which cinema advertising prices are modelled as the dependent variable (Y), and seating capacity, weekly programming frequency, and weekly average attendances, as independent explanatory variables (X1, X2, and X3) – the product of all three can be understood as determinants of the box-office.
Cinema Weights
Unfortunately, the list of cinemas for which advertising price data is found in the Répertoire publicitaire du cinéma belge does not coincide fully with the list of cinemas for which programming data has been collected. Where this is the case, cinema weights have been awarded based on the type of films being screened at those cinemas, their vintage, and their position in the cinema hierarchy. These are set out below in Tables 2 and 3 and show ranges varying from 2.28 (Rex) to 0.33 (Rio) in Antwerp and Ghent 3.03 (Capitole) and 0.33 (Muide and Vriendenkring). The revenue capacity of cinemas varied considerably, by multiples of approximately seven and nine respectively in the two cities.
| Weekly Attendances | |||||||||
|---|---|---|---|---|---|---|---|---|---|
| Cinema | Cinema weight | Seats | Weekly screenings | Q1 | Q2 | Q3 | Q4 | Mean weekly attendance | Price per meter (fr.) |
| Ambassade | 1,06 | 450 | 35 | 4531 | 4797 | 3309 | 5826 | 4616 | 65 |
| Americain* | 0,41 | 792 | 25 | ||||||
| Anvers Palace | 1,95 | 1494 | 35 | 9528 | 10095 | 8187 | 11975 | 9946 | 120 |
| Astra | 1,30 | 800 | 28 | 6391 | 5732 | 7807 | 6795 | 6681 | 80 |
| Astrid | 1,63 | 600 | 28 | 5816 | 7176 | 6843 | 6818 | 6663 | 100 |
| Capitole | 1,63 | 1148 | 49 | 8801 | 8368 | 7996 | 9266 | 8608 | 100 |
| Century | 0,81 | 790 | 16 | 3142 | 3167 | 3271 | 3886 | 3367 | 50 |
| Coliseum | 1,30 | 900 | 35 | 2276 | 1866 | 6675 | 5130 | 3987 | 80 |
| Crosly* | 0,41 | 700 | 25 | ||||||
| Dixi | 0,81 | 900 | 18 | 4464 | 4072 | 3912 | 4264 | 4178 | 50 |
| Eden | 1,06 | 820 | 35 | 4094 | 5645 | 3923 | 4825 | 4622 | 65 |
| Empire | 1,95 | 1567 | 35 | 9519 | 7858 | 7083 | 8959 | 8355 | 120 |
| Festa | 0,81 | 560 | 35 | 5419 | 4804 | 4479 | 5148 | 4963 | 50 |
| Luxor | 0,81 | 1000 | 17 | 3945 | 3214 | 2911 | 3302 | 3343 | 50 |
| Majestic | 0,65 | 1100 | 29 | 2790 | 2017 | 2915 | 2396 | 2530 | 40 |
| Metro | 2,28 | 2000 | 35 | 13130 | 13808 | 9197 | 13090 | 12306 | 140 |
| National | 0,65 | 920 | 18 | 3571 | 3290 | 3016 | 3970 | 3462 | 40 |
| Odeon | 1,63 | 700 | 42 | 7790 | 6805 | 6527 | 7223 | 7086 | 100 |
| Pathé | 1,63 | 1000 | 49 | 10675 | 8837 | 9790 | 12060 | 10341 | 100 |
| Plaza | 0,65 | 550 | 18 | 2364 | 2226 | 2575 | 2535 | 2425 | 40 |
| Regina | 0,65 | 300 | 35 | 2554 | 2754 | 2252 | 3260 | 2705 | 40 |
| Rex | 2,28 | 1065 | 49 | 13769 | 13499 | 12674 | 14168 | 13528 | 140 |
| Rio** | 0,33 | 500 | 20 | ||||||
| Roma | 1,30 | 2000 | 16 | 6836 | 7312 | 6603 | 7709 | 7115 | 80 |
| Roxy | 1,30 | 1825 | 28 | 6063 | 5567 | 5643 | 7486 | 6190 | 80 |
| Rubens | 1,63 | 1200 | 9562 | 6629 | 7620 | 7854 | 7916 | 100 | |
| Savoy | 1,06 | 700 | 42 | 4227 | 4001 | 4379 | 5499 | 4527 | 65 |
| St Jan* | 0,41 | 700 | 25 | ||||||
| Studio Movy | 0,81 | 400 | 35 | 4229 | 4192 | 3753 | 5887 | 4515 | 50 |
| Victory | 0,65 | 800 | 17 | 1540 | 1410 | 1383 | 1754 | 1522 | 40 |
Sources: Cinema Belgica dataset; Répertoire publicitaire du cinéma belge, 1954
Notes: *Assume a category 1 cinema, charging 25 cents per meter for advertising/promotional films; ** assume a category 2 cinema, charging 20 cents per meter for advertising/promotional films.
| Weekly Attendances | |||||||||
|---|---|---|---|---|---|---|---|---|---|
| Cinema | Cinema weight | Seats | Weekly screenings | Q1 | Q2 | Q3 | Q4 | Mean weekly attendance | Price per meter (fr.) |
| Agora | 0,63 | 600 | 18 | 1571 | 1770 | 1335 | 1698 | 1594 | 25 |
| Cameo | 0,63 | 590 | 8 | 1790 | 1961 | 2020 | 2181 | 1988 | 25 |
| Capitole | 3,03 | 1700 | 28 | 10375 | 10892 | 8740 | 10965 | 10243 | 120 |
| Casino | 0,63 | 550 | 12 | 1431 | 1399 | 1311 | 1698 | 1460 | 25 |
| Century | 1,64 | 775 | 28 | 5817 | 4719 | 4992 | 5847 | 5344 | 65 |
| City | 1,01 | 530 | 8 | 3707 | 3573 | 3205 | 3742 | 3557 | 40 |
| Eldorado | 1,64 | 608 | 35 | 4454 | 4539 | 3001 | 4657 | 4163 | 65 |
| Forum | 0,63 | 540 | 8 | 1766 | 1702 | 1274 | 1872 | 1654 | 25 |
| Ganda | 0,51 | 550 | 18 | 2158 | 1954 | 1940 | 2319 | 2093 | 20 |
| Ideal | 0,63 | 491 | 8 | 2424 | 2361 | 2067 | 2709 | 2390 | 25 |
| Leopold* | 0,63 | 547 | 25 | ||||||
| Lido | 1,01 | 500 | 18 | 2873 | 3105 | 2513 | 3538 | 3007 | 40 |
| Majestic | 2,53 | 958 | 28 | 7588 | 7150 | 5940 | 7929 | 7152 | 100 |
| Metropole | 1,01 | 690 | 27 | 4783 | 4212 | 3798 | 4780 | 4393 | 40 |
| Muide*** | 0,33 | 186 | 8 | 13 | |||||
| Nord Palace | 0,63 | 400 | 18 | 1703 | 1451 | 1535 | 1808 | 1624 | 25 |
| Nova | 0,63 | 550 | 5 | 1096 | 1152 | 968 | 1279 | 1124 | 25 |
| Novy | 1,01 | 560 | 4189 | 3737 | 3367 | 4321 | 3904 | 40 | |
| Odeon | 0,63 | 420 | 10 | 1700 | 1579 | 1598 | 2138 | 1754 | 25 |
| Pax | 1,01 | 700 | 646 | 666 | 620 | 966 | 725 | 40 | |
| Plaza | 1,64 | 750 | 28 | 3995 | 3522 | 3770 | 5002 | 4072 | 65 |
| Rex | 1,26 | 698 | 28 | 3724 | 3251 | 2948 | 4321 | 3561 | 50 |
| Rio | 0,63 | 460 | 8 | 1492 | 2004 | 1131 | 1235 | 1466 | 25 |
| Ritz | 0,63 | 374 | 12 | 637 | 776 | 578 | 1140 | 783 | 25 |
| Roxy | 0,63 | 420 | 11 | 1197 | 1404 | 1296 | 1502 | 1350 | 25 |
| Royal | 1,01 | 800 | 18 | 4853 | 4486 | 3775 | 5011 | 4531 | 40 |
| Savoy | 1,26 | 590 | 28 | 3949 | 3514 | 2785 | 4029 | 3569 | 50 |
| Scala | 1,01 | 850 | 18 | 4500 | 40 | ||||
| Scaldis** | 0,51 | 332 | 20 | ||||||
| Select | 1,01 | 547 | 28 | 2732 | 2409 | 2525 | 3251 | 2729 | 40 |
| Vooruit | 2,02 | 1500 | 28 | 7389 | 7022 | 7726 | 9039 | 7794 | 80 |
| Vox | 0,63 | 450 | 1705 | 1588 | 1551 | 1882 | 1682 | 25 | |
| Vriendenkring | 0,33 | 350 | 154 | 154 | 13 | ||||
Sources: Cinema Belgica dataset; Répertoire publicitaire du cinéma belge, 1954
Notes: *Assume a category 1 cinema, charging 25 cents per meter for promotional films; ** assume a category 2 cinema, charging 20 cents per meter for promotional films; *** assume a category 3 cinema, charging 13 cents per meter for promotional films.
The next task is to apply them to the film programming data. For each ith film, a cinema weight is given for each jth billing, which, when multiplied by the length of run and billing status, gives rise to a POPSTAT value. A POPSTAT Index value is formed when POPSTAT values are aggregated across all jth cinemas at which each ith film appears. From this, it is possible to construct a popularity index, which can be compared to other popularity indices.
Further Research
This story suggests a method for investigating cinema's popularity in two Belgian cities in 1952. It can be applied to other cities and accordingly serve as a basis for doing comparative analysis. For instance, the divide in the diet of films consumed in Belgium during the German occupation can be investigated using these methods. POPSTAT also facilitates the exploration of historical changes in audience tastes and associated cultural issues. An example here could be the decline in the influence of religious and political silos, the classical “pillars” on cinemagoing habits.
Other Sources and Data
Researchers who are interested in the POPSTAT methodology can also look at:
- European Cinema Audiences: the POPSTAT methodology is used in this comparative research project on seven cities across Europe, including Ghent;
- Cinematek: the library of the Royal Film Archive or Cinematek contains dozens of Belgian trade journals and yearbooks where one can find statistical data on Belgium's film exhibition scene.
Further Reading
- Browning, H., and Sorrell, A., (1954). 'Cinema and cinema going in Great Britain', Journal of the Royal Statistical Society, 117, 133 165.
- Pafort-Overduin, C., Sedgwick, J., and Van de Vijver, L. (2018). 'Identifying cinema cultures and audience preferences: a comparative analysis of audience choice and popularity in three medium-sized Northern European Cities in the Mid-1930s ', TMG Journal for Media History, 21(1), 102–118.
- Sedgwick, J. (2000). Popular filmgoing in 1930s Britain: a choice of pleasures. Exeter: University of Exeter Press.
- Sedgwick, J., (2002). 'Product Differentiation at the Movies: Hollywood, 1946-65', Journal of Economic History, 62, 676-704
- Sedgwick, J. (2006) 'Cinemagoing in Portsmouth During the 1930s', Cinema Journal, 46(1), 52–85.
- Sedgwick, J. (2020). From POPSTAT to RelPOP: A Methodological Journey in Investigating Comparative Film Popularity. TMG Journal for Media History, 23(1-2), 1–9. DOI: http://doi.org/10.18146/tmg.776
- Sedgwick, J., Pafort-Overduin, C. and Boter, J. (2012) 'Explanations for the restrained development of the Dutch cinema market in the 1930s', Enterprise and Society, 13(3), 634-671.
- UNESCO (1952), Basic Facts and Figures. Paris: UNESCO.
Author
John Sedgwick is an economic historian who researches film history. He is interested in the ontological characteristics of film as a commodity and film popularity and what these tell us about comparative audience preferences and industry processes and structure. He has written a monograph, edited an anthology, and published articles in leading academic journals.